Physical activity shifts the age at which age-related muscle loss becomes disabling, without removing the decline itself. Muscle strength and mass peak around age 30. They then decline by less than 1% a year, before accelerating to 1 to 2% a year according to a review published in 2024 (PubMed ). A figure from that review is now circulating on social media. It comes with a promise: according to a follow-up of 83,209 Swedish adults, exercise would delay aging by 30 years. The core message holds. The numbers attached to it do not survive a reading of the sources.
What the curve actually represents
The figure comes from a review published in 2024 by Thomas Gustafsson and Brun Ulfhake, two Swedish researchers. Its subject is sarcopenia, meaning the age-related loss of muscle strength and mass (PubMed ). The authors describe it as a “schematic representation”, and no individual data are plotted on it.
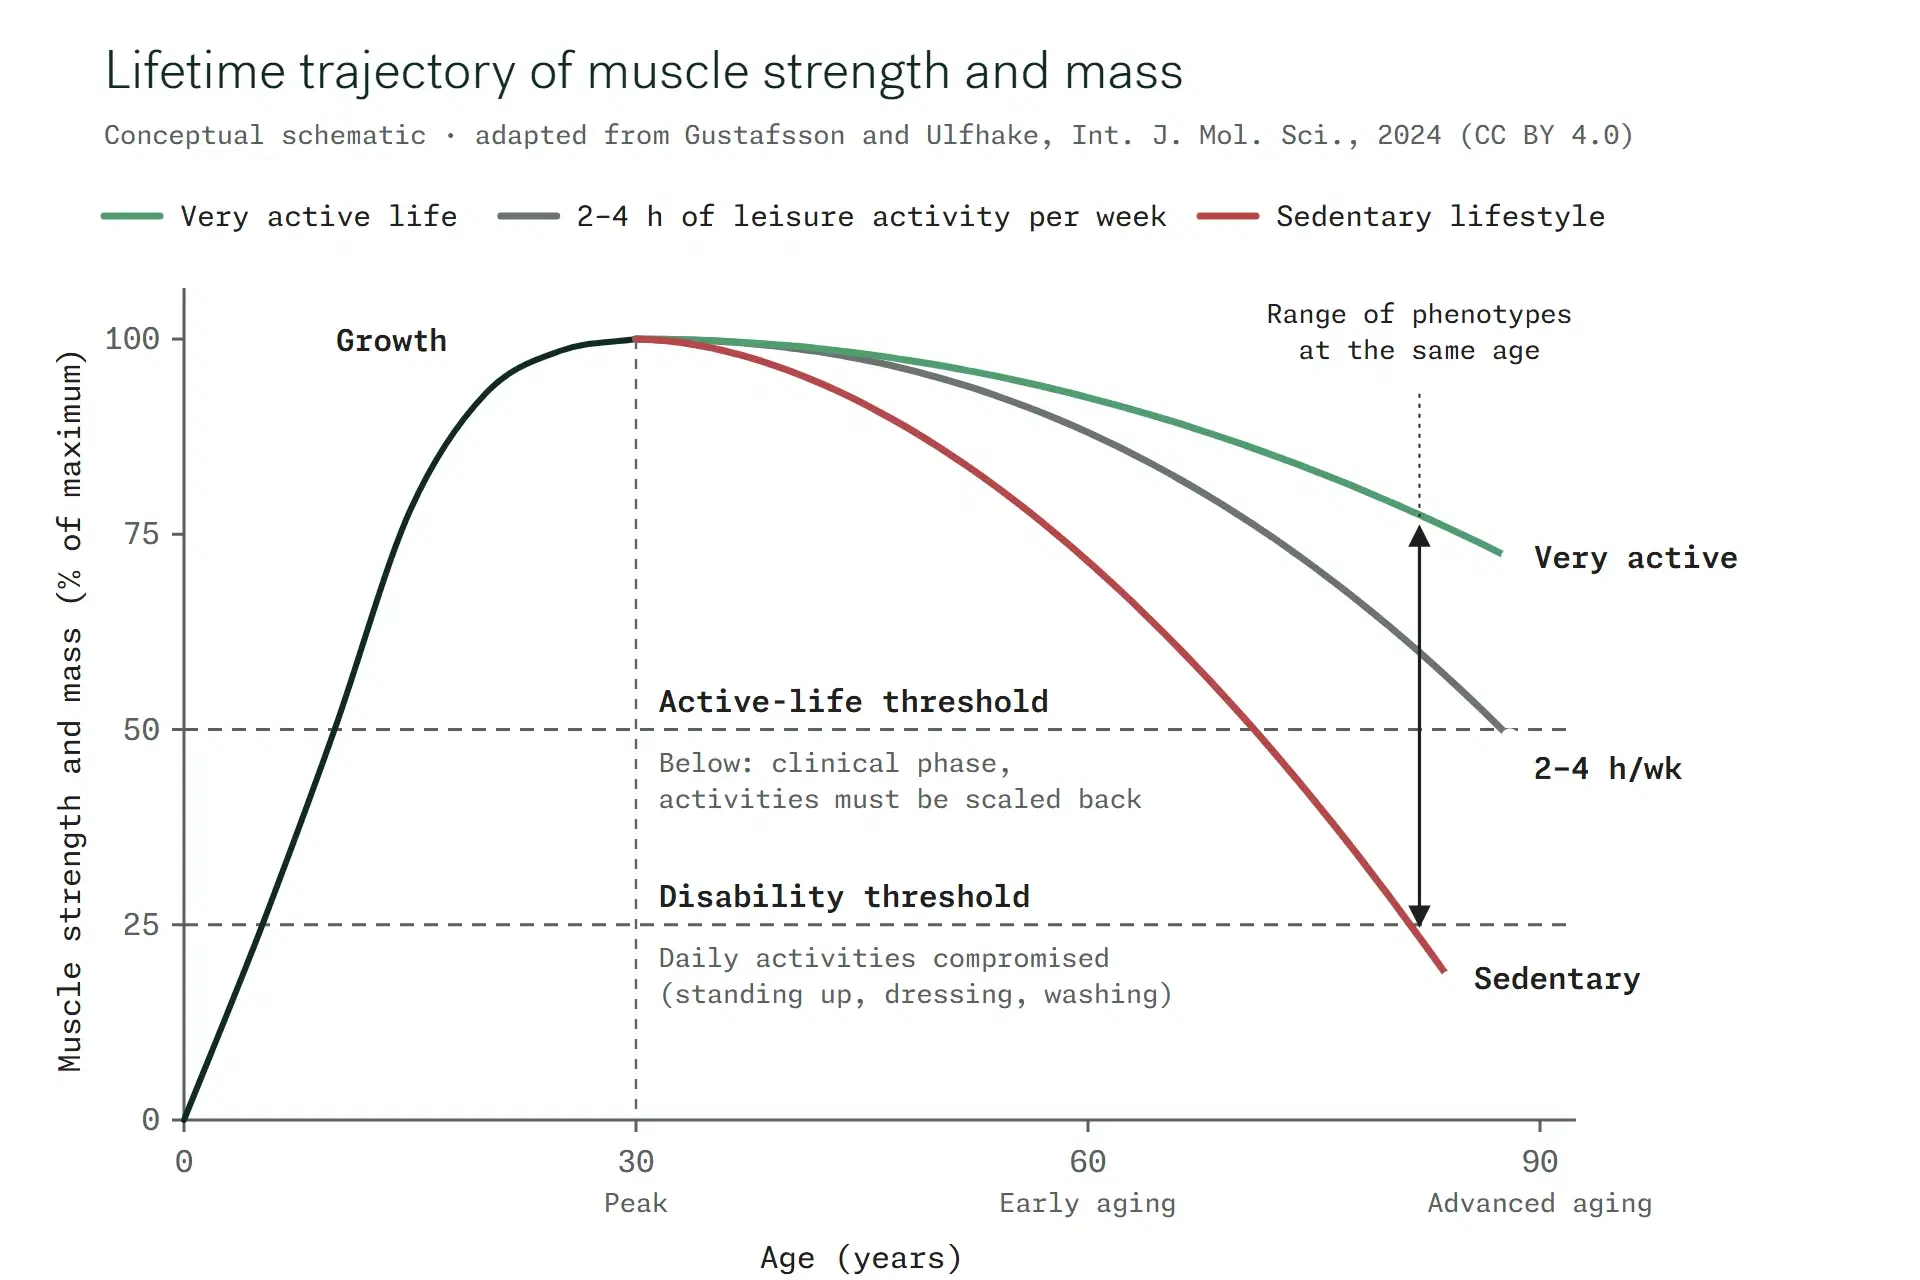
Three trajectories start from the same peak, reached between ages 25 and 35 depending on the type of activity. The green curve stands for a very active life, the red one for a sedentary lifestyle. The gray one corresponds to 2 to 4 hours of leisure-time activity per week. Two horizontal lines divide the space. Above the first lies the so-called preclinical phase, where the loss exists without affecting everyday tasks. Below that line begins the clinical phase: activities must then be scaled back to cope with the loss of strength. The second line marks disability, the point at which standing up from a chair, dressing or washing becomes difficult without help.
The caption sums up the issue in one sentence. The range of phenotypes, meaning observable physical profiles, results from both genetic makeup and lifestyle. At the same age, two people can sit on either side of the disability threshold.
Where the “83,209 Swedes” and the “110 years” come from
The number 83,209 does appear in the review's bibliography. It refers to competition results, recorded by 34,132 Swedish masters athletes aged 35 to 97, across sixteen track and field disciplines (PubMed ). That study describes how performance declines with age in trained athletes. It does not compare active and sedentary people, and none of the three curves is drawn from it.
As for the age of 110, it comes from a different operation: extending the hand-drawn green curve until it meets the disability threshold. Extrapolating a schematic produces no result. Only the mention of 2 to 4 hours a week actually appears in the caption, as an illustration.
A decline that starts around 30, in everyone
The loss of strength and contraction speed precedes the loss of muscle mass. It becomes measurable from the thirties onward, in elite athletes as in population-based cohorts (PubMed ). According to the authors, by the time an untrained person notices it, the process has already been under way for decades.
A Swedish cohort, meaning a group of people followed over time, shows the same pattern without relying on athletes. Its 425 participants, born in 1958, took physical tests at ages 16, 34 and 52. Their physical capacity rose until 34, then fell by 15 to 20% between ages 34 and 52. The decline affected men and women alike, in every test but one (PubMed ).
Decline in physical capacity measured in a Swedish cohort followed for 36 years, in men and women alike.
Masters athletes show that training does not erase this slope. In the Swedish data, performance declined 1.7 times faster after age 70 than before in men, and 1.4 times faster in women (PubMed ). World records by age group trace the same profile: a nearly linear decline until somewhere between 70 and 80, followed by an acceleration (PubMed ).
Norman Lazarus and Stephen Harridge, physiologists at King's College London, read in these records the trace of aging itself, stripped of the effects of inactivity. They derive a hypothesis from it: there would be a level of activity below which aging accumulates avoidable damage. Above that level, training would improve performance without any further health benefit (PubMed ). The idea remains a theoretical proposal that no trial has yet tested.
What activity changes: the age of crossing
The figure places the stakes on the age axis rather than on the slope. For independence, what counts is the moment each trajectory meets the disability threshold. That moment depends on two parameters: the height of the peak reached around 30, and the speed of the descent.
Individuals of the same age still differ widely, even among the most active. A London team measured a broad range of functions (cardiac, respiratory, muscular, metabolic, cognitive) in 125 highly active cyclists aged 55 to 79 (PubMed ). Maximal oxygen uptake (VO2max, the amount of oxygen the body can use at peak effort) was the measure most closely tied to age. Even so, it could not tell a participant's age.
Activity type matters too. In 94 runners aged 58 on average, followed for almost five years, lean mass (everything in the body that is not fat) remained stable. Their isometric strength, measured against a fixed resistance with no joint movement, still fell by about 5% a year for knee extension (PubMed ). The authors conclude that running alone does not preserve strength. The Swedish review points the same way. Endurance training improves the heart, circulation and mitochondria, the energy plants of the cells. It does less to protect muscle strength and mass at advanced ages (PubMed ).
A randomized trial on the disability threshold
The LIFE trial tested directly the question the figure raises. It randomly assigned 1,635 sedentary people aged 70 to 89, already physically limited but able to walk 400 meters (PubMed ). One group followed a moderate activity program combining walking, strength and flexibility work, twice a week at a center and three to four times at home. The other, the comparison group, attended health education workshops.
After 2.6 years on average, 30.1% of the active group had lost the ability to walk 400 meters, compared with 35.5% of the comparison group. The risk was 18% lower. Persistent loss of mobility affected 14.7% of active participants and 19.8% of the others (PubMed ). Here is the measured version of the gap between the green and the red curves: a delayed, quantified crossing of the threshold, in a real population.
The only validated lever in humans
Gustafsson and Ulfhake review the biomedical avenues under study. They aim to replace cells, to clear senescent cells (cells that have stopped dividing and keep inflammation going), to exploit the chemical messengers released by muscle, or to protect the nerves that control it. Some are being tested in animals or in humans. Their conclusion is clear. To date, the only evidence-based intervention in humans is exercise, including in frail people with several age-related conditions (PubMed ).
The effect can be measured even at a very advanced age. In 1994, a randomized trial put 100 frail nursing home residents, aged 87 on average, through ten weeks of progressive resistance training (PubMed ). Their strength rose by 113%, compared with 3% in those who did not train, and their walking speed by 11.8%. A multinutrient supplement, tested in the same trial, changed none of the outcomes the trial had set out to measure first.
Even one session a week brings progress within a few weeks for most people, first through better control of balance and movement (PubMed ). The review's recommendations come down to the following:
- combine endurance and resistance training, whose effects complement each other;
- in frail individuals, start with balance and flexibility, then add endurance and strength;
- aim for about 150 minutes of moderate activity per week, spread over three sessions;
- track strength rather than muscle size past a certain age, because the fibers' response to training becomes blunted.
Periods of immobilization deserve particular attention. Fewer than ten days of enforced inactivity are enough to cut noticeably into muscle mass. Repeated through illnesses and injuries, these episodes may weigh heavily in the cumulative loss (PubMed ). The review recommends keeping them as short as possible, then offsetting them with targeted retraining. Grip strength benchmarks by age and sex are detailed in our article on resistance training.
A reserve built before the decline
The review closes on an observation that shifts the focus. The trajectory itself, a peak around 30 followed by an accelerating descent, appears universal: the authors consider it built into human biology rather than acquired. Heredity would explain at least 50% of the differences in muscle mass and strength between individuals, compared with about 25% for lifespan (PubMed ). The researchers therefore call for studying adults who have just passed their peak, rather than those in whom the loss is established.
For each of us, the practical consequence is simple: the muscle reserve is built during the decades when the decline remains invisible.
Frequently asked questions
References
- Gustafsson T, Ulfhake B. Aging Skeletal Muscles: What Are the Mechanisms of Age-Related Loss of Strength and Muscle Mass, and Can We Impede Its Development and Progression? Int J Mol Sci. 2024;25(20):10932 (PubMed ).
- Ganse B, Kleerekoper A, Knobe M, Hildebrand F, Degens H. Longitudinal trends in master track and field performance throughout the aging process: 83,209 results from Sweden in 16 athletics disciplines. Geroscience. 2020;42(6):1609-1620 (PubMed ).
- Westerståhl M, Jansson E, Barnekow-Bergkvist M, Aasa U. Longitudinal changes in physical capacity from adolescence to middle age in men and women. Sci Rep. 2018;8(1):14767 (PubMed ).
- Lazarus NR, Harridge SDR. Declining performance of master athletes: silhouettes of the trajectory of healthy human ageing? J Physiol. 2017;595(9):2941-2948 (PubMed ).
- Pollock RD, Carter S, Velloso CP, et al. An investigation into the relationship between age and physiological function in highly active older adults. J Physiol. 2015;593(3):657-680 (PubMed ).
- Marcell TJ, Hawkins SA, Wiswell RA. Leg strength declines with advancing age despite habitual endurance exercise in active older adults. J Strength Cond Res. 2014;28(2):504-513 (PubMed ).
- Pahor M, Guralnik JM, Ambrosius WT, et al. Effect of structured physical activity on prevention of major mobility disability in older adults: the LIFE study randomized clinical trial. JAMA. 2014;311(23):2387-2396 (PubMed ).
- Fiatarone MA, O'Neill EF, Ryan ND, et al. Exercise training and nutritional supplementation for physical frailty in very elderly people. N Engl J Med. 1994;330(25):1769-1775 (PubMed ).
- Wall BT, Dirks ML, van Loon LJ. Skeletal muscle atrophy during short-term disuse: implications for age-related sarcopenia. Ageing Res Rev. 2013;12(4):898-906 (PubMed ).